When to Buy Airline Tickets Continued
First, a brief re-introduction. A few months back, I thought it would be a cool experiment to use crowdsourcing to optimize my choices in buying airplane tickets.
Unfortunately, though, I didn’t really finish what I started. This post is going to fix that.
To spice things up a little bit, I added over 3000 data points to this analysis over the last one, so things are not only going to look cooler, but they’re going to be more accurate as well. Before I delve into the actual statistics of all the information I gathered, I’m going to give a little overview of how I actually made this all happen, or you can skip straight to the results.
A Crash Course in Mechanical Turk 
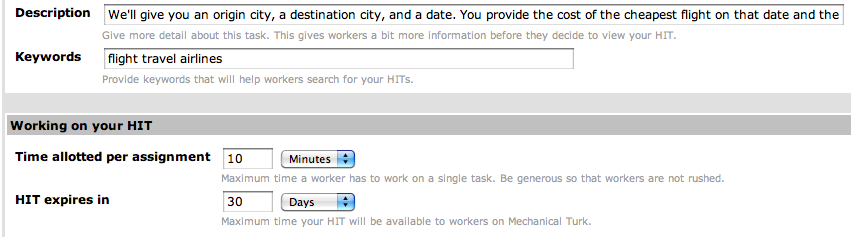
Amazon has a nice and easy interface for adding batches of jobs like these. You can specify a description, some keywords (this makes it easier for “Turkers” to find your job), and various other variables, such as the time alotted per assignment and the amount of time before a HIT (Human Intelligence Task) expires.
Once you do this, you basically have to figure out a few more things.
- A data set.
- A way for Turkers to enter in the data they find (using the form interface on the MTurk website).
This is a short snippet of code that generated the random data for the trips.
SECONDS_IN_YEAR = 28425600
CITIES = ["MIA", "LAX", "JFK / LGA", "SFO"]

def write_random_trips(n):
    for i in xrange(n):
        row = random.sample(CITIES, 2)
        r = random.randint(0, SECONDS_IN_YEAR)
        d = datetime.fromtimestamp(time.time() + r)
        row.append(d.strftime("%B %d %Y"))
    print "%s,%s,%s" % (row[0], row[1], row[2])
I uploaded it as a CSV, and Amazon automatically divvied up the prompts to the Mechanical Turk users.
The Waiting Game 
This is, by far, the most gut-renching part of the Mechanical Turk experience. After submitting your batch of HITs to Amazon, it can take anywhere from 8 to 12 hours for them all to get finished. As people complete the tasks, you have the ability to accept or reject the submissions (when you reject a submission, you should give a reason to the Turker who completed it). This is a little tedious, but it’s pretty important if you want to weed out bad data.
Once the batch is complete, you have the option to export the results to a CSV. From there, you can do whatever you’d like with the data. I packaged it up nicely so that Mathematica could make some sense of it.
Results 
The first thing I wanted to see once I had everything in hand was pretty obvious (at least to me): What is the cheapest time of year to fly?
The following is a chart plotting day-of-year versus average price for that day.
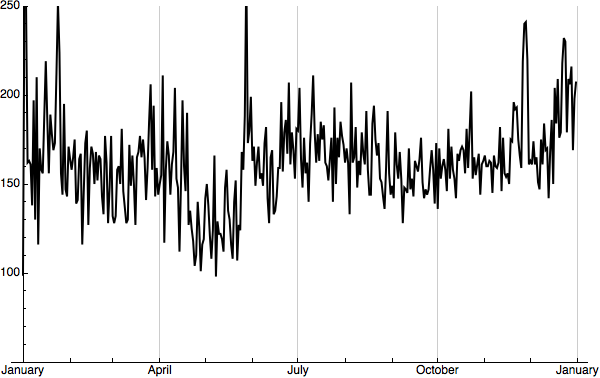
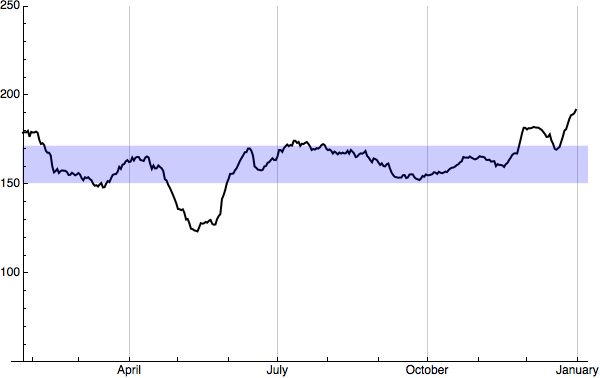
The above isn’t so useful. It’s pretty hard to extrapolate a trend from really jagged data like this. I decided that a 30-day moving average would be a lot smoother and easier to interpret. Below is the result. The average ticket price was $160.97 and the data stayed within a small range of the average (the standard deviation was $13.00).
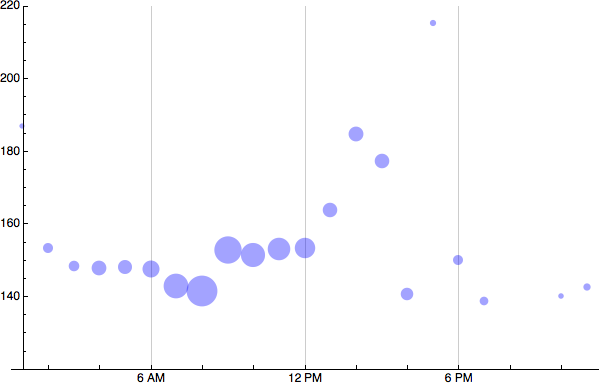
Another thing I wanted answered was the best time of day to order airplane tickets. Unfortunately, I didn’t get many data points for periods in the middle of the night, so the data is a little skewed. The graph below charts time against ticket price, with the size of the circle representing the number of data points for that time period.
Here’s a table of average prices for each day of the week. Thursday is the most expensive day to fly, and Saturday is the cheapest.
| Day | Average Price |
|---|---|
| Monday | $159.40 |
| Tuesday | $159.36 |
| Wednesday | $161.91 |
| Thursday | $174.45 |
| Friday | $163.28 |
| Saturday | $148.03 |
| Sunday | $166.98 |
And here I have it split up by city.
Miami 
| Day | From | To |
|---|---|---|
| Monday | $167.12 | $164.45 |
| Tuesday | $169.38 | $169.66 |
| Wednesday | $172.03 | $166.51 |
| Thursday | $191.08 | $195.11 |
| Friday | $172.70 | $169.38 |
| Saturday | $158.23 | $162.29 |
| Sunday | $169.63 | $199.33 |
LA 
| Day | From | To |
|---|---|---|
| Monday | $156.99 | $149.67 |
| Tuesday | $151.45 | $148.48 |
| Wednesday | $155.18 | $156.65 |
| Thursday | $161.57 | $160.00 |
| Friday | $158.27 | $155.47 |
| Saturday | $139.68 | $136.49 |
| Sunday | $162.16 | $161.00 |
NYC 
| Day | From | To |
|---|---|---|
| Monday | $161.94 | $161.81 |
| Tuesday | $161.35 | $163.19 |
| Wednesday | $161.08 | $160.20 |
| Thursday | $170.15 | $170.40 |
| Friday | $169.09 | $166.63 |
| Saturday | $144.02 | $149.75 |
| Sunday | $172.48 | $152.12 |
SFO 
| Day | From | To |
|---|---|---|
| Monday | $151.42 | $160.71 |
| Tuesday | $156.91 | $155.49 |
| Wednesday | $158.25 | $165.31 |
| Thursday | $175.48 | $173.05 |
| Friday | $152.99 | $161.57 |
| Saturday | $146.91 | $144.94 |
| Sunday | $162.94 | $162.26 |
Interpretation and Conclusion 
Without a doubt, the fact that LA and San Francisco are so close to each other definitely had an effect on the final results. The cities I chose were, more or less, based on my personal travel habits, so it’s highly likely that someone with a wildly different grouping of “home airports” would get different results.
No matter what, though, it seems that Saturday is the cheapest day to fly, and Thursday is the most expensive. For the best deals, you should buy your tickets from 6:00-8:00am PST. For the cheapest trip, plan for something in mid-May.
If you’d like to check out the dataset, or have any questions about how I created these graphs, please don’t hesitate to send me an email.